Research Report
Get in the Game
Understanding and responding to customer needs is the key to unlocking retail growth, but it’s not always easy to do. This report shows how real convenience retailers are using the Playbook for Success, the North America NACS Council’s 2013 report, to strengthen their offerings to customers as the path to growing sales.
Praise for The Playbook and shopper research
Category management was a transformative process that completely changed the way we conducted business…. Shopper research has the same potential to alter the course of history for convenience retailers.
Fran Duskiewicz
Nice ‘N Easy Grocery Shoppes
“I would consider it as a springboard for any operator who wants to attract the four segments…. It’s a great tool.”
Rahim Budhwani
CEO 6040 LLC
“Small retailers can benefit from the Playbook, and we plan to continue using it to defend our turf and to attract new business.”
Mary Braddock
Owner, Meiners Companies
The Playbook for Success is an easy-to-use tool for all c-store operators who want to grow their business. The report uses findings from a broad base of shopper research to determine where customer needs are not being met, and how c-stores can increase trips and overall sales by better meeting those needs. The three action steps are flexible and adaptable to the current positioning of individual operators, and tools are provided to help decide where to start and how to measure success.
Carol Jensen
Chief Marketing and Brand Officer of Wawa
As a first time attendee at the NACS convention and a newcomer to the world of c-stores, I was intrigued and very impressed by what the Playbook for Success can mean to c-stores and retailers. I immediately saw the benefits that Cenex® stores could gain by using this three-step guide to help grow their business and build a solid foundation for years to come.
I’m very excited to share this tool with the network of 1,400 Cenex-brand retail locations, including at our upcoming Cenex Buyer’s Fair. I believe it is a breakthrough for the c-store industry that is sure to make a positive impact in the immediate future.
Julieta Piox
Marketing Specialist, CHS Inc.
Read the report
The Playbook for Success outlines a three-step plan for growing c-store business based on shopper research, and introduces four new business platforms.
Pregame Introductions
When the NACS/Coca‑Cola Retailing Research Council put the Playbook for Success on the field in 2013, convenience retailers picked up the ball and ran with it. Here, we report on how five of them are using the Playbook to grow their businesses.
Scouting the market to find opportunity
Shopper research is the foundation of the Playbook growth strategies, and many convenience retailers are just beginning to realize its potential. Three of them agreed to share their shopper research experiences for this report.
- Handy Mart devised a deliberate plan to survey shoppers and evaluate store performance using Playbook tools.
- Meiners fielded the Playbook’s shopper survey less formally, but with good results.
- Mid-Atlantic Convenience Stores (MACS Circle K) piloted the use of a direct observation shopper research technique called market basket analysis to evaluate a new commissary offering.
Get in the Game: Attracting new business
Steps 1 and 2 of the Playbook’s growth program involve maximizing business from existing customers. Step 3 involves attracting new customers. Read about two retailers who executed against the Playbook’s Fresh Value Fast platform and one who executed against the Female Friendly platform, and find out what they learned from the results.
Each of these retailers puts their own spin on the Playbook’s research methods, principles, tools and platforms to identify opportunities and achieve their business goals. Use their stories to think about how your business can “get in the game.”
The Playbook at a Glance
Grow your business one step at a time
Meeting shopper needs for each step builds the foundation for the next, so it’s important to take them in order.
- Deliver on the basics. Research says: Shoppers need a clean, safe environment, frustration-free shopping and consistent value. Up your game on the basics to earn more business from current customers and capture new ones who’ve been passing you by.
- Defend your turf. Research says: Shoppers need consistency of service, staff friendliness and courtesy. C-stores dominate the grab-and-go occasion, but they significantly under-perform in these areas compared to competitive channels like dollar stores and fast food outlets. Enhance service to core customers to defend your turf.
- Attract new business. Research says: Shopper needs go beyond the conventional grab-and-go occasion. If you’re already delivering on Steps 1 and 2, you’re ready to serve shopper needs that go beyond grab-and-go. The research indicates these needs cluster around four potential growth platforms.
Use the playbook toolkit
To do your own shopper research. The Playbook’s simple, easy-to-field survey allows you to determine your “Shopper Satisfaction Score.” Use this tool to identify which growth step you’re ready to tackle. Then use it to measure the effectiveness of the changes you put in to play.
To evaluate your store performance. Two self-evaluation tools will help you assess how well your stores are delivering against the shopper needs that drive Steps 1 and 2. If you’re not delivering against these needs consistently, you’ve still got room to grow your existing business.
When you’re ready for step 3...
Consider one of four new business platforms built around shopper needs:

Fresh value fast

Family time

My time

Female friendly
Part 1: Scouting for Opportunity
What shopper research can do for you
C-stores often focus a lot of attention on their competitors. This is understandable, but chasing the competition is at best a stay-even/zero-sum game. To GROW store business, the best strategy is to focus on shoppers, and the best method for learning about their needs (and whether or not you’re meeting them) is shopper research. It’s different from the more well-known consumer research, and the difference is important to understanding how it can help you grow your business.
Shopper research focuses on understanding the shopping occasion. What do shoppers want/need/desire as they approach a shopping occasion (i.e. the door to your store)? How well does their current shopping experience satisfy those wants/needs/desires?
The goal of shopper research is to identify ways to drive retailer growth.
Consumer research is about understanding product usage. What do consumers want from the product and how well does the product satisfy those wants and needs?
The goal of consumer research is to find ways to drive brand growth.
Fran Duskiewicz, a senior executive with Nice N Easy, was an early adopter of shopper research who became a champion once he saw what it could do for their stores:
We used to use the words ‘shopper,’ ‘consumer,’ and ‘customer’ interchangeably — then we learned from shopper research that each of these roles has a completely different influence on our business, even though they are acted by a single person. A consumer selects a specific product. When they purchase it, they become your customer, but in-between they are ‘shoppers’ — and what the shopper brings to the store may be the need for a reward, or a break from a busy day, or to take care of themselves by eating something ‘better than fast food.’ Once I understood shopper needs, I started to see opportunities to meet them everywhere I looked. That’s when I knew I’d stumbled on a game-changer.
Fran Duskiewicz
Nice N Easy
In the following pages, we’ll show you how three convenience retailers are using shopper research to identify growth opportunities for their stores.
Handy Mart decides to focus on the basics.
Handy Mart operates a successful, well-run chain of 40 stores located primarily in eastern North Carolina.
Handy Mart had never put a high priority on shopper research before, but when a company executive read about the Playbook in NACS Magazine, he was attracted to the idea and thought the time was right to try it. After contacting the Council for more information, Handy Mart decided to use the Playbook tools to
- Do shopper research across all their stores.
- Measure how well they were delivering on basic needs and against the competition.
- Explore which new shopper platforms would make the most sense for them.
Listening to shoppers
To do their shopper research, Handy Mart used the Playbook’s Shopper Satisfaction Survey. First they consulted with researchers at NACS to make sure they were going to be able to collect a good sample, then they hired college students on break to conduct more than 400 shopper interviews at 36 stores. Once the surveys were tabulated, they shared the results with management and supervisors, including store operators.
Evaluating store performance
Results in hand, managers and supervisors filled out the two self-evaluation tools included in the Playbook. The first measures how well stores are delivering against Step 1 shopper needs — safety, cleanliness and frustration-free shopping. The second measures how well stores are delivering on service, hospitality and courtesy; meeting these Step 2 needs helps you “defend your turf” from competitors.
Exploring new platforms
Finally, managers and supervisors were asked their input on which of the four growth platforms made the most sense for their stores.
Translating research into action
Handy Mart’s deliberate execution produced useful results in all three areas.
- Analysis of the shopper research results revealed that most stores scored well above 70 in most areas— but there was still some significant variation among the different stores.
- The self-evaluation exercise identified a number of areas where the company could improve on the basics, and it also generated some concrete ideas for “defending their turf.”
- The new platform exploration did not result in consensus. While some stores felt ready to go after Fresh Value Fast customers, others saw potential in Family Time or My Time. Many pointed out the challenge of trying to go after a single platform when the stores themselves differed in age, footprint and customer-base — a challenge faced by many convenience retailers. Among the comments: “It’s going to be hard to pick a program that will work in all the stores…. All our stores are so different, meaning the customers. It’s all based on the area and the customers needs in that area.“
And the winner is...
Handy Mart’s overall shopper satisfaction scores (many above 70) qualified it to tackle a Step 3 new growth platform according to the Playbook’s rating system — but there was also significant variation between some of the stores.
In the end, Handy Mart decided to build their game plan around executing against Step 1: Deliver on the Basics.
- The Playbook identified that there was still room to grow existing business if stores weren’t delivering consistently on Steps 1 and 2.
- Improving delivery on the basics was a program that could be executed across all of their stores, and one that would “lift all boats.”
Meiners finds a need to defend its turf.
Meiners is a family owned and operated chain of 6 stores in the greater Kansas City area whose stores are connected with branded food service operations.
Meiners’ approach to shopper research was more informal than Handy Mart’s, but it, too, revealed valuable opportunities to build the business. Like Handy Mart, Meiners read about the Playbook in a trade magazine. The family team that manages the company wanted to confirm they were getting the right messages across to their shoppers, but they didn’t want to invest a lot of money in shopper research until they knew it was worth the effort. The Playbook’s Shopper Satisfaction Survey gave them an affordable way to try it, so after talking to the Council’s research director, they put the survey into the field.
My company was encouraged by the feedback that indicated we were doing a lot of the basics correctly such as clean restrooms and friendly staff. However, we were surprised that customers were not aware of the multiple price promotions offered throughout the store.
Mary Braddock
Owner, Meiners Companies
Surprising results
By the time they’d conducted 100 interviews, Meiners’ shoppers had indicated clear opportunities in three areas:
- Strengthening the price appeal of sandwich and hotdog combo meals.
- Increasing the assortment and improving the price on cigars.
- Communicating weekly specials more consistently.
Shoppers told them that a major competitor was making a broader offer with combo deals, that shoppers liked it, and that Meiners may be losing sales to the competition already. Their cigar supplier had suggested they had an “opportunity gap” to fill, and the shopper research confirmed this. Finally, surveys indicated that they needed to be more consistent in the way they communicated special pricing, especially the way they used their mobile app to alert customers about specials.
Acting on the research
Since then, Meiners has rolled out a new cigar offer, laid the groundwork for a broader choice of combo meals, and revitalized app promotions; now these are set up months in advance and roll out to customers automatically on a weekly basis. “This more consistent approach will improve Meiners’ reputation for good promotions and will increase sales,” says owner Virginia Stanton.
The Playbook gave us a simple (and affordable) tool to use to collect customer feedback.
Mary Braddock
Owner, Meiners Companies

MACS: Market baskets reveal shopper missions.
Mid-Atlantic Convenience Stores (MACS Circle K) have ~300 company-owned and dealer locations in Maryland, Virginia, Washington, D.C., and Delaware.
5one, a global consultancy that enables customer centricity across all retail verticals, led the basket mission part of this pilot.
MACS approached shopper research from a different direction. They were already committed to launching a new commissary line, and they wanted to find a way to measure its impact. Through the Council, they learned about market basket analysis from 5one, a consulting group that specializes in customer-centric approaches to retail growth, and the two organizations agreed to undertake a pilot project.
As you’ll see in Part 2, the new product launch and pilot were successful, but first let’s look at what market basket analysis is, how it works, and what MACS learned from it.
What is market basket analysis?
Market basket analysis is a shopper insight technique that directly observes shopper behavior by looking at the items that shoppers purchase together (in one “basket”). The goal is to understand the “mission” the shopper is trying to accomplish when they come to the store.
Market basket missions are a way to understand how the shopper is shopping.
- They allow you to learn from the spending of all your customers, not just a sample.
- They don’t require customer-identified data.
- They provide a way to view shopper behavior variations across both stores and dayparts.
How does it work?
Two sets of retailer data are required to identify basket missions. MACS supplied 5one with:
- a history of transactions
- the product hierarchy that describes how MACS layers items in their transaction data
Then 5one executed a three-step analysis.
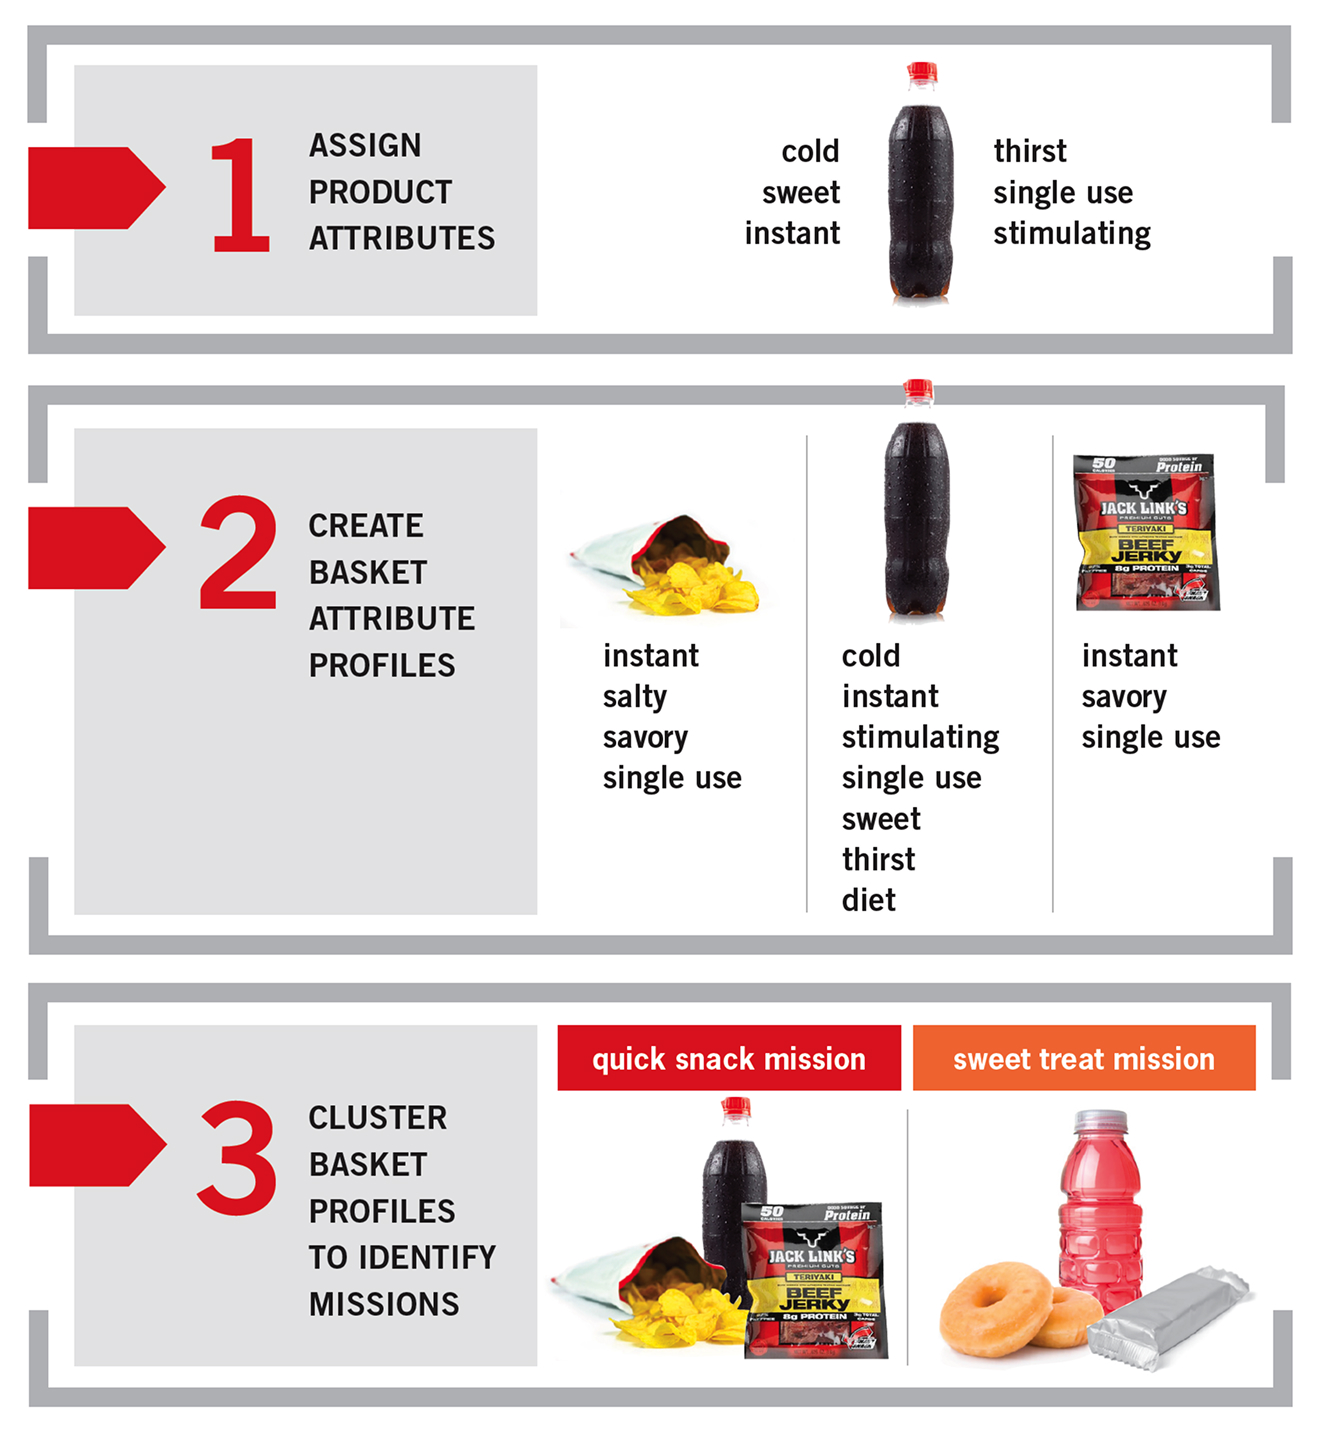
- Every product was assigned attributes that described its functions and key characteristics from the shopper’s point of view.
- Every basket was given an attributes profile based on the products purchased together.
- A sophisticated algorithm was used to identify baskets with distinct and similar attribute profiles and to group them together to form “basket missions.”
All in all, 8,000 items were assigned attributes in the MACS study, and 5one identified 4 meal missions, 2 beverage missions, and 3 vice missions were identified. MACS used the meal missions to evaluate with its commissary product launch, but they also learned much more from the analysis.
What can you learn from market basket missions?
Market basket missions can give you a far more detailed picture of how shoppers use your stores than general category labels like “neighborhood,” “commuter” or “highway” stores.
When 5one’s analysis was complete, MACS had access to a treasure trove of information about how shoppers used their stores that they could mine for opportunities. They could see
- Which missions were more common, and therefore more important to shoppers.
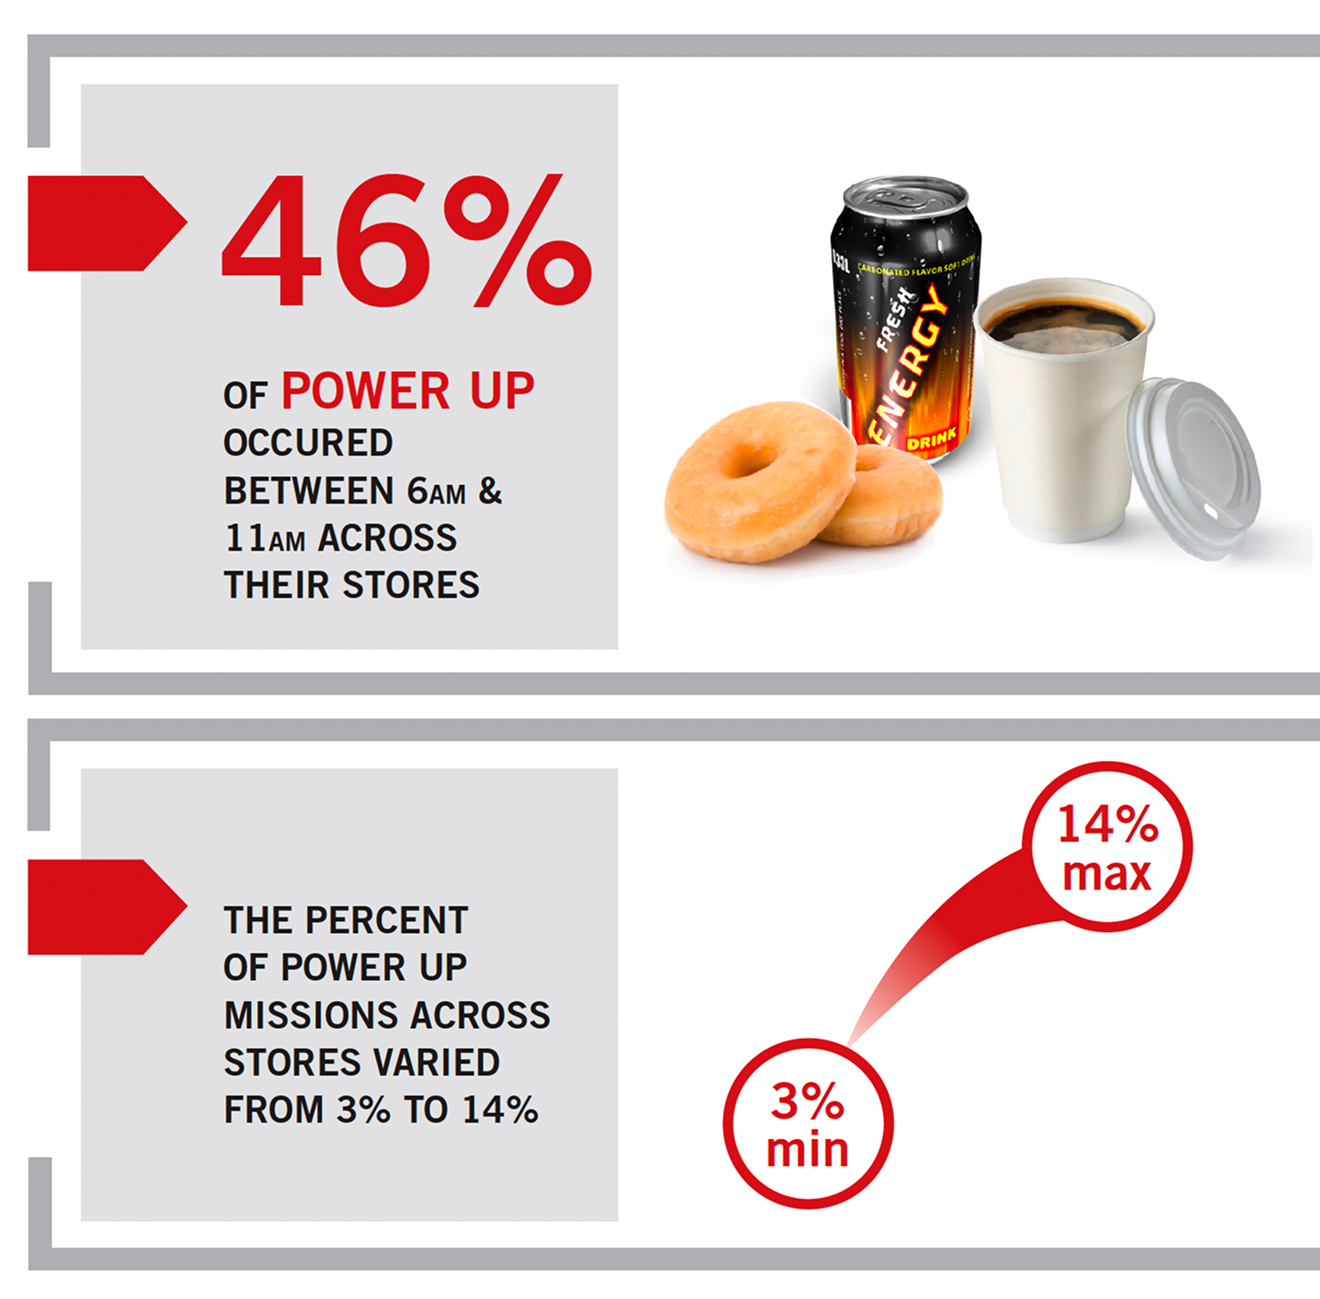
- How shoppers used stores at different times of day — i.e. how the mix of missions shifted by daypart.
- How shoppers used different stores, and where clusters of stores served similar missions.
- Where there were opportunities for quick wins by tailoring promotions to missions instead of products.
Read about how MACS applied market basket missions to the launch of new commissary products to increase basket sizes in Part 2.
MACS learned...
The difference between POS data and market basket analysis
Scan data is one dimensional and simplistic, although valuably so. It tells you how many units you sold of specific items, but not what’s going in the customer’s overall shopping mission. For instance, when you run a promotion on a single serve refreshment item, your scan data will tell you the lift on that item, but it won’t tell you that people purchased complimentary products (like a salty snack) at the same time. Market basket analysis helps you understand these kinds of relationships.
These insights into the products that shoppers buy together gives you opportunities to connect promotions with maximizing overall profitability growth. For instance, finding that sales of a complimentary product significantly increase when you promote another product can suggest merchandising strategies within the store — and it can warn you away from simultaneously price-promoting the complimentary product. (Why give away margin when sales will increase anyway?)
If you’re really serious about focusing on specific shopper missions to attract more business, market basket analysis will strongly suggest more optimal product assortment.
Hank Armour
President and CEO of NACS
Part 2: Get in the Game
If you’ve already accomplished Steps 1 and 2 — that is, if you’re consistently delivering on core needs and you’ve already taken steps to defend your “grab-and-go” turf — you’re ready for Step 3: Attract new business.
There’s no single “right way” to build out the four Playbook growth platforms. As you’ll see in the following pages, each retailer will interpret them based on their own strengths and circumstances. The only rule is to pick just one. If you cherry pick elements from different platforms, you run the risk of trying to be everything to everyone, standing for nothing, and doing nothing particularly well.
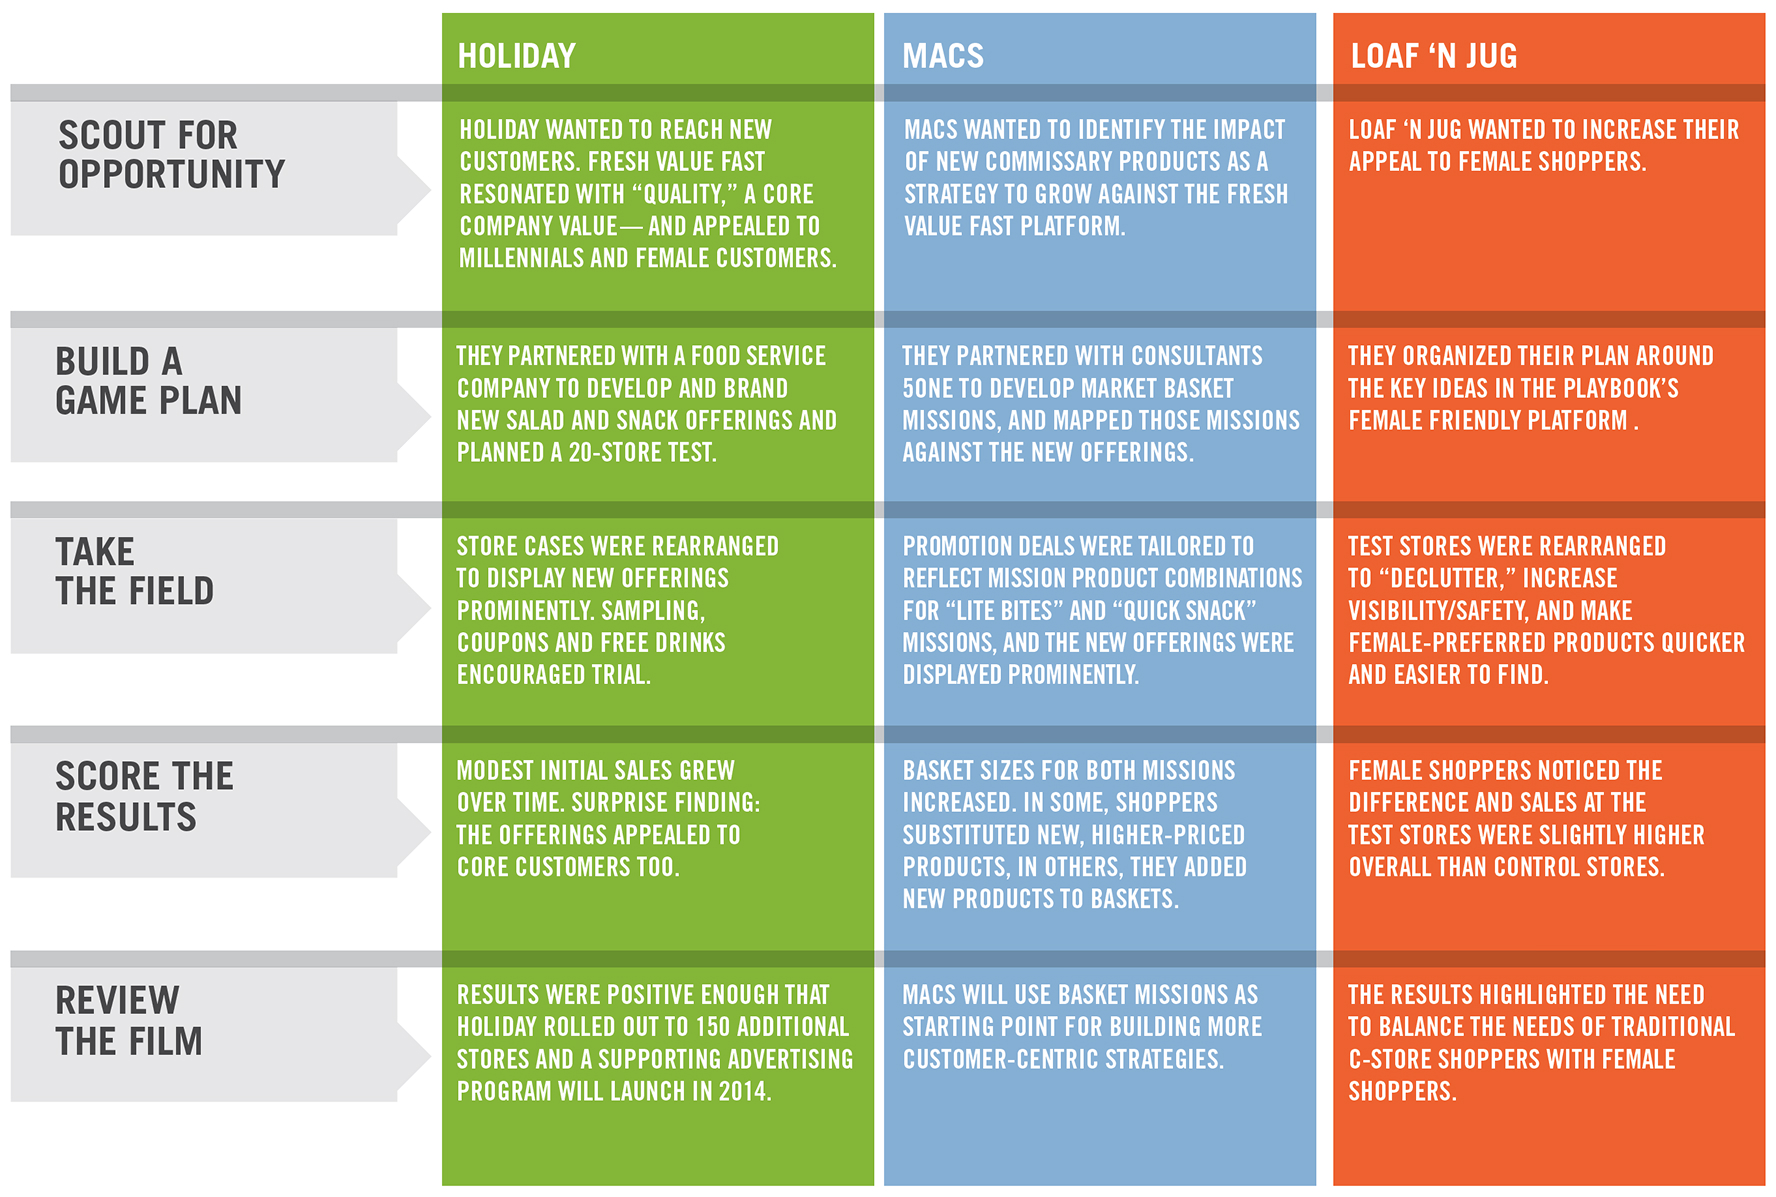
Use the Scorecard on the next page to quickly compare how three convenience retailers are using the platforms in different ways to build their businesses, then read on for the details of each story.
The Playbook identified four significant opportunities for convenience retailers to serve shopper needs beyond the grab-and-go occasion. Each platform adds some new feature, service, or both, to appeal to customers beyond the basics of convenience shopping:

Fresh value fast

Family time

My time

Female friendly
Scorecard: Three approaches to capturing new convenience business
Holiday takes on fresh value fast.
Privately-owned Holiday StationStores, Inc. has nearly 500 stores located in Alaska, Idaho, Michigan, Minnesota, Montana, North Dakota, South Dakota, Washington, Wisconsin and Wyoming. About one quarter are franchise sites, the rest are corporate stores.
In order to grow, Holiday stores knew that they needed to reach new customers. They also knew it was important to stay true to their simple-to-execute core programs and offerings.
A play for young adults and females
The Playbook’s Fresh Value Fast growth platform appealed to them for several reasons. They’d watched McDonald’s succeed with a new lineup of fresh and healthy options. They knew that young adults and female customers were looking for fresher, healthier alternatives — and “fresh and healthy” correlated well with one of the company’s core customer promises “quality.” They hypothesized that customers would come more frequently if they had choices, even if they didn’t always select the healthiest option.
Encouraging trial
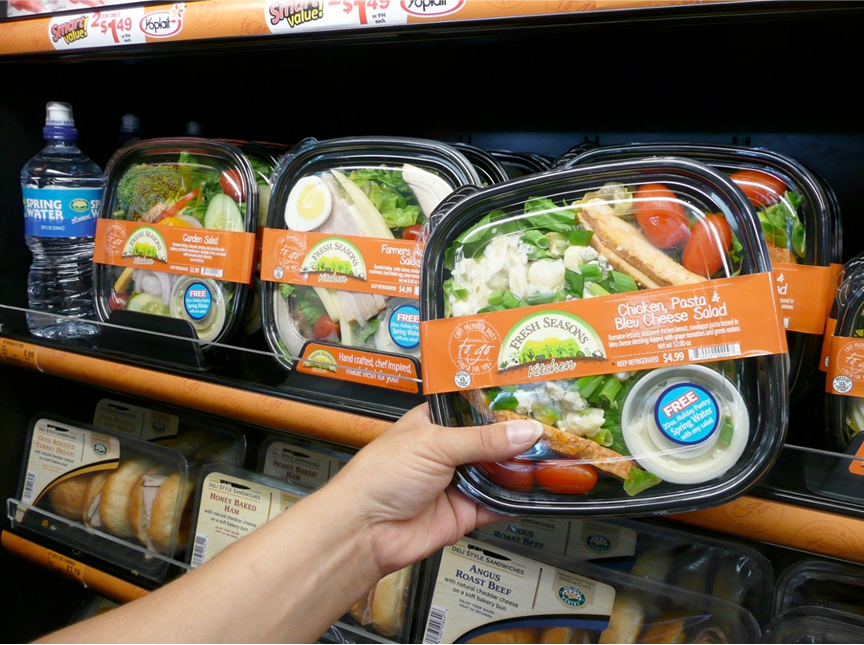
Holiday already delivered high-quality heat-and-serve products that appealed to the chain’s customer base of adult males, but fresh and healthy was a whole new ball game. They partnered with a food service company to develop the new offerings. The centerpiece was a line of fresh, appealing salads backed up by a fresh, attractive line of “better-for-you” grab-and-go snacks.
They tested the new products in a cross-section of 20 stores in the Twin Cities area.
- To display the new options prominently, they repositioned shelving and signage.
- To encourage trial, they offered customers a free coffee or soda for completing an online questionnaire about the new products.
- Customers also received coupons for free bottled water or a dollar discount on the purchase of a salad.
President and Chief Operating Officer Brent Blackey told Convenience Store News, “We wanted to make sure there was a clear value proposition for trying something new, especially something that maybe isn’t quite as well accepted in a convenience store.”
There’s a learning curve for customers as well as Holiday here, you have to work hard in an area you don’t hold.
Brent Blackey
President and Chief Operating Officer
Sales climbed as the weather grew warmer
You have to work hard to communicate new offers to both associates and customers, and Holiday did this.
The new lineup launched with modest sales, but the company remained committed. They saw sales climb as the weather grew warmer, and in a surprise finding, they learned that “fresh and healthy” appealed to many of their core adult male customers also. “There’s a learning curve for customers as well as Holiday here,” says COO Blackey, “You have to work hard in an area you don’t hold.”
Lessons learned
- Fresh and healthy appeals to many of the store’s core adult male customers as well.
- Sampling helps validate the quality of the products in customers’ minds.
- Coupons promote trial.
- On-site messaging is important, and broader marketing and advertising helps reach new customers.
Positive results prompt a 150-store roll-out
Results were positive enough that Holiday rolled out the offering to approximately 150 additional Twin Cities-area stores in the second half of 2013, and they are planning a major promotional emphasis in 2014 supported by an advertising campaign.
MACS builds bigger baskets
Mid-Atlantic Convenience Stores (MACS Circle K) have ~300 company-owned and dealer locations in Maryland, Virginia, Washington, D.C., and Delaware.
MACS had already decided that they needed to “raise the bar” with their foodservice offering when they elected to do a pilot using a data-driven customer-centric approach called basket missions under the guidance of consulting firm 5one. MACS was committed to adding a high-level, commissary-prepared fresh product line, and basket missions would give them a way to:
- Learn how the new products impacted shopping missions.
- Identify opportunities to fine tune the program’s execution by increasing emphasis on the new products at stores where the market basket missions that included them were more common and reducing emphasis in stores where the opposite was true.
New products
The new products included cut fruit, parfaits, sub sandwiches, and wedges.
The plan involved identifying the basket missions where the new commissary line was most likely to serve shopper needs and measuring their impact on those basket missions. They focused first on Lite Bite Missions (small meals for on-the-go that tend to be more healthy and picked up in the morning), and Quick Snacks (impulse salty snacks and drinks to fill in between meals at any time of the day).

Bigger baskets
When MACS looked at the sales results through the basket mission lens, they found results they expected, and some surprises.
- The fruit and parfait were included in a majority of Lite Bite missions. Both products seemed to align well with the needs of customers on this mission.
- Sub sandwiches and wedges were well received by customers who were on a Quick Snack mission.
- The surprise learning? Sub sandwiches and wedges also sold well as part of a third mission — Hot and Ready — a sign of nice growth potential in this part of the business.
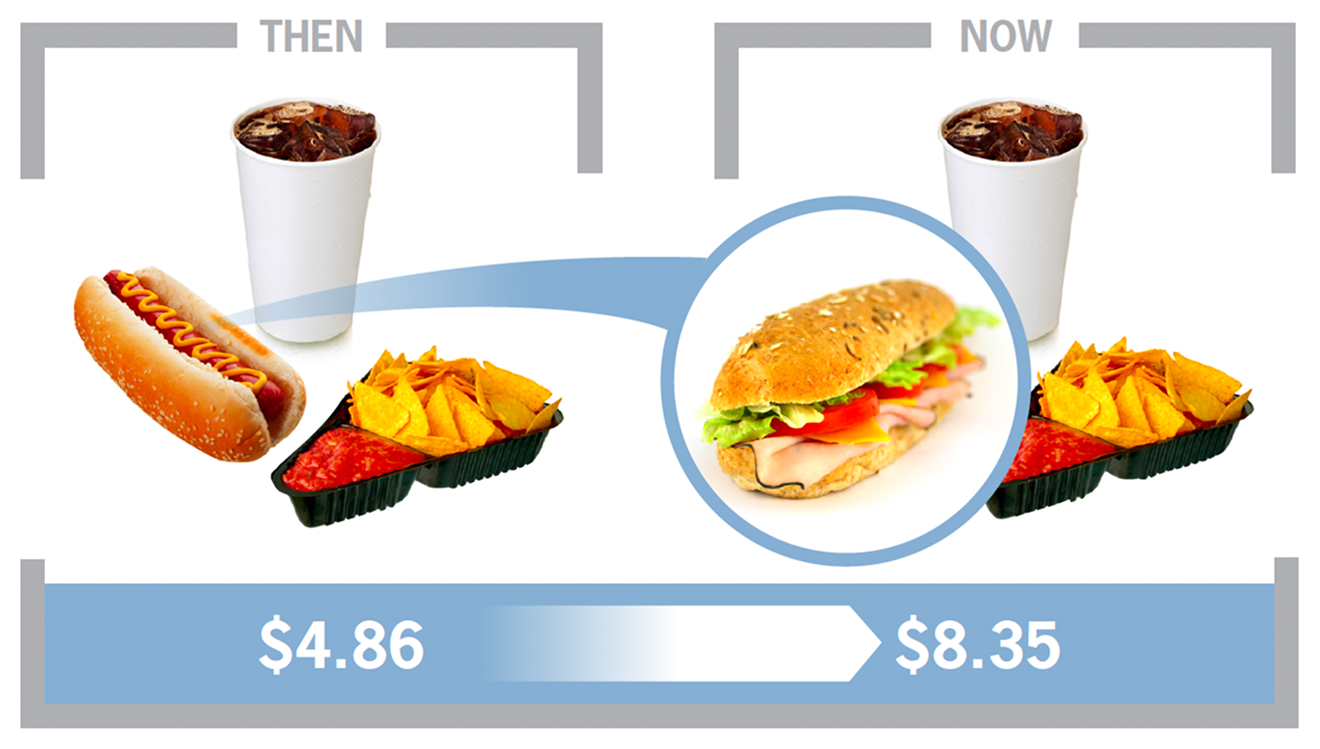
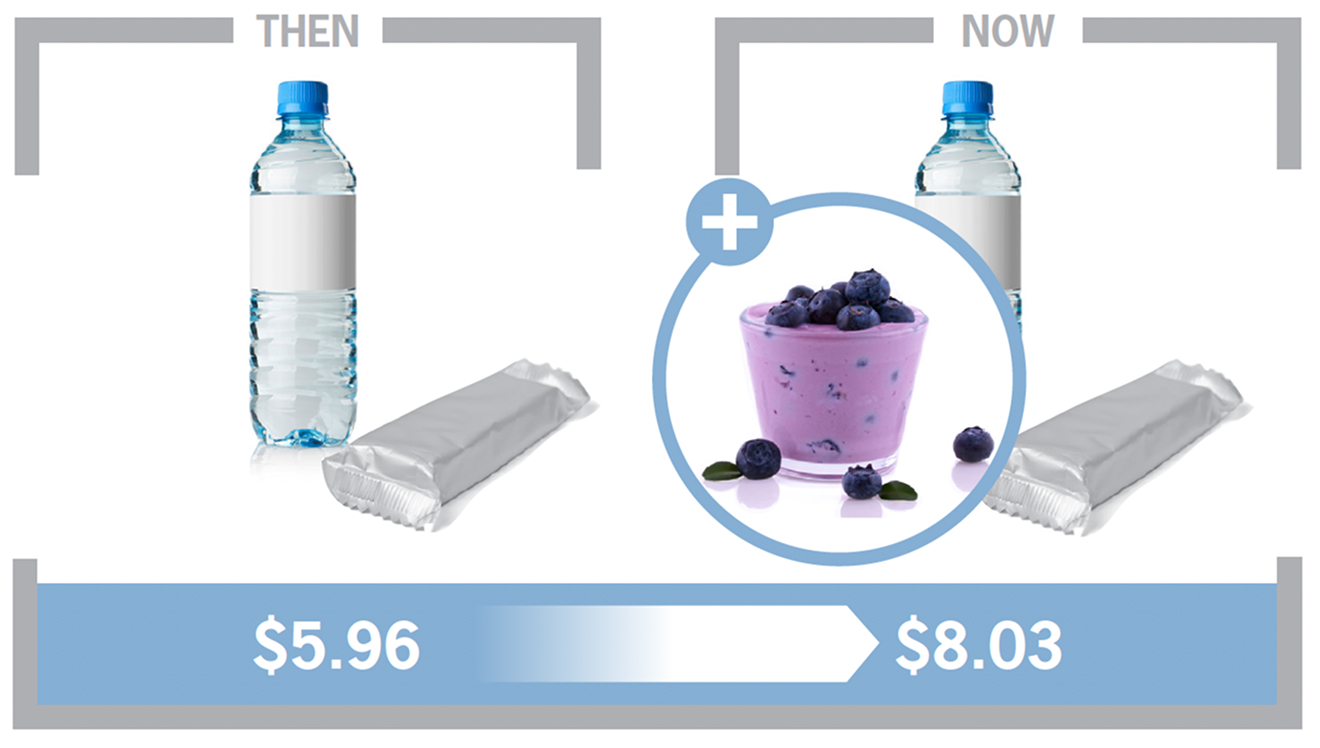
The introduction of the new commissary products also grew the average amount spent on both Hot and Ready and Lite Bite market baskets.
- Hot and Ready mission baskets increased from $4.86 to $8.35, as more expensive subs and wedges were substituted for less expensive hot dogs.
- Lite Bite baskets grew from $5.96 to $8.03, as shoppers added yogurts and parfaits to these.
Hot and Ready
Lite Bite
Next steps
The merchandising and marketing team at MACS is looking at using this lens to build a more customer-centric approach and to improve the effectiveness of store-specific merchandising decisions in three areas:
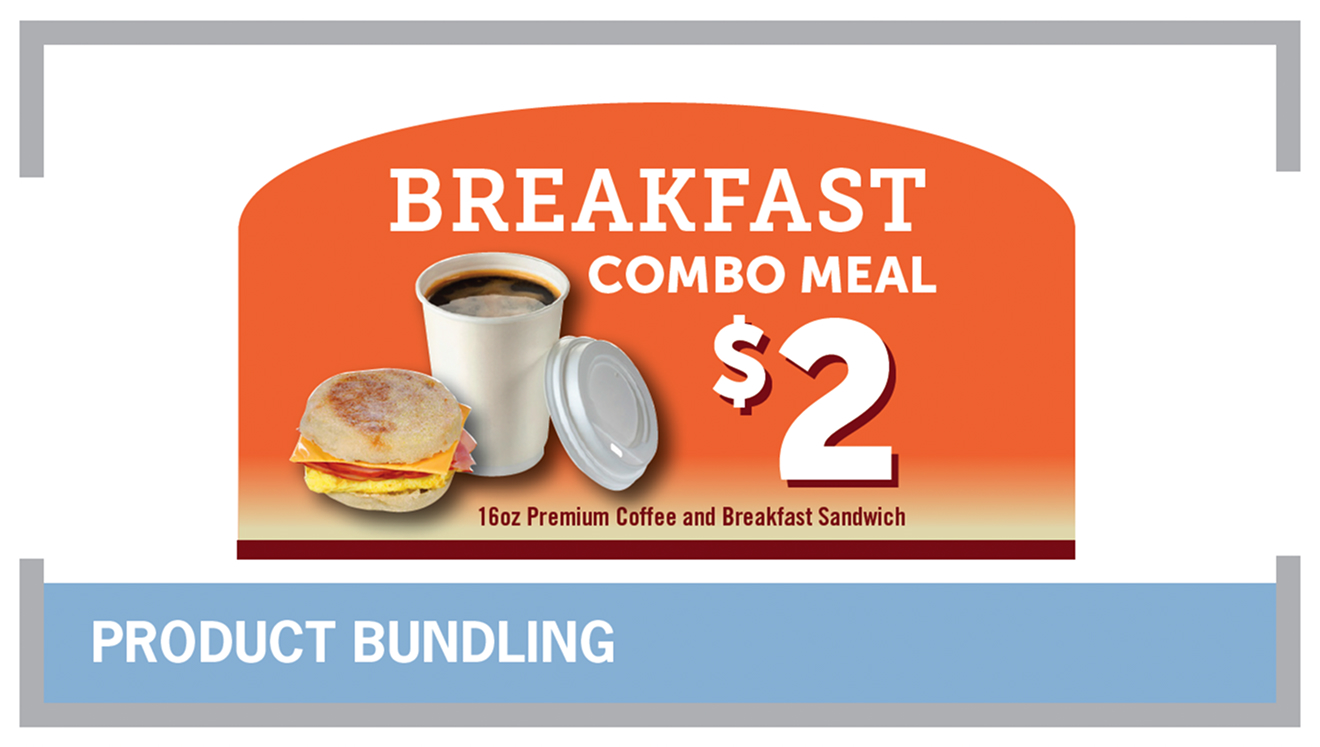
- Focusing pricing strategies on missions rather than traditional product combinations.
- Developing more mission-specific promotions that encourage customers to add products to baskets and/or trade up to higher quality/higher-priced items.
- Adjusting store assortments to align more closely with the most popular missions of customers shopping a given store or cluster of stores.
Traditional
Mission Driven
Loaf ‘N Jug appeals to female shoppers
Loaf ‘N Jug is a division of the Kroger Company that operates 170 stores, primarily in Colorado and Wyoming.
When Loaf ‘N Jug looked across the Playbook’s four growth platforms, they saw an opportunity to attract more business from female shoppers without detracting from their core convenience store identity. They built their pilot around the concepts identified in the Playbook’s Female Friendly growth platform:
- Female customers need to feel safe and comfortable.
- Atmosphere and product selection are crucial to attracting female shoppers.
- Malls, coffee shops, and drugstores also compete for these customers.
- Target occasions are morning commute coffee and afternoon/evening coffee/snack break.
- The goal is to become a place where women can take a break in their day.
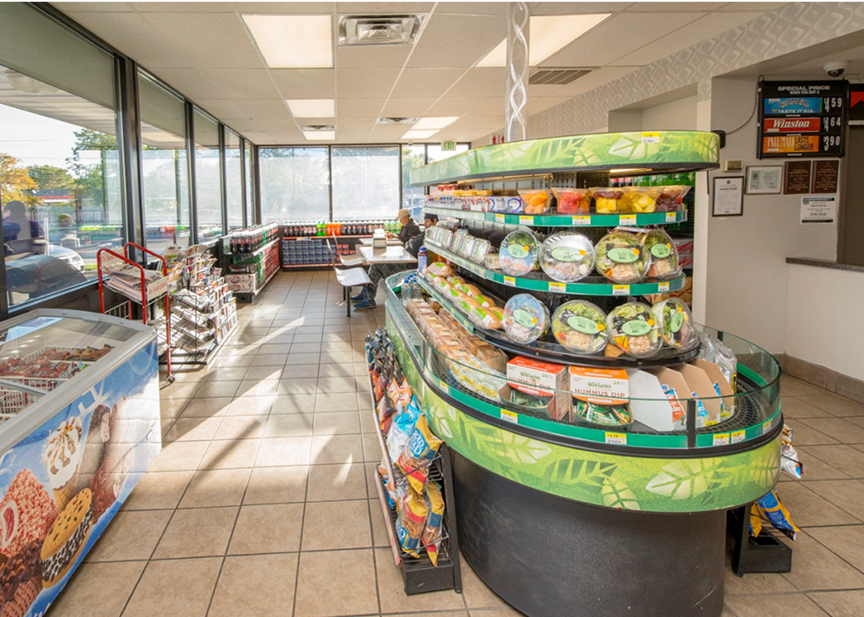
Loaf ‘N Jug’s female friendly test stores
Three test stores were rearranged to create a more open and inviting atmosphere and to showcase products preferred by females.
No changes were made at five control stores: Outside, window signs continued to promote conventional C-store products like cigarettes, lottery, and hot dogs, and exterior product displays were stacked high. Inside, all portable racks and displays remained in place in the front of the store. Heavier snack items remained in the most prominent locations, and cooler signs still targeted products preferred by male shoppers.
Pricing and promotions remained the same at both test and control stores— only the products listed on the promotion signs differed.
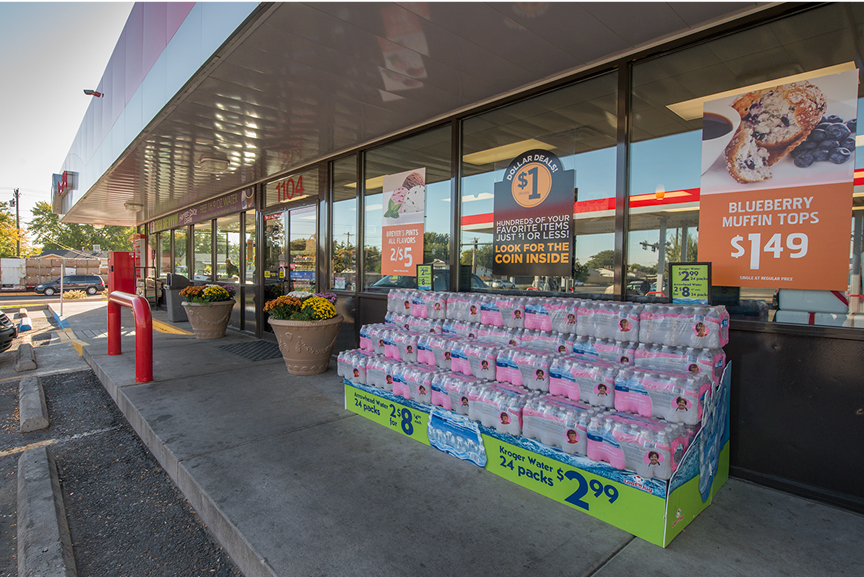
To create a more open and inviting atmosphere
Window signage was reduced to improve the visibility into and out of the store.
Some outside display sizes and profiles were reduced so they didn’t block the windows.
Some interior signage was redesigned to make it more contemporary.
Clutter inside was reduced. Displays, ice barrels and candy racks located in high-traffic areas at the front of the store were removed or relocated to promote an open feel.
Added flowers at the front door.
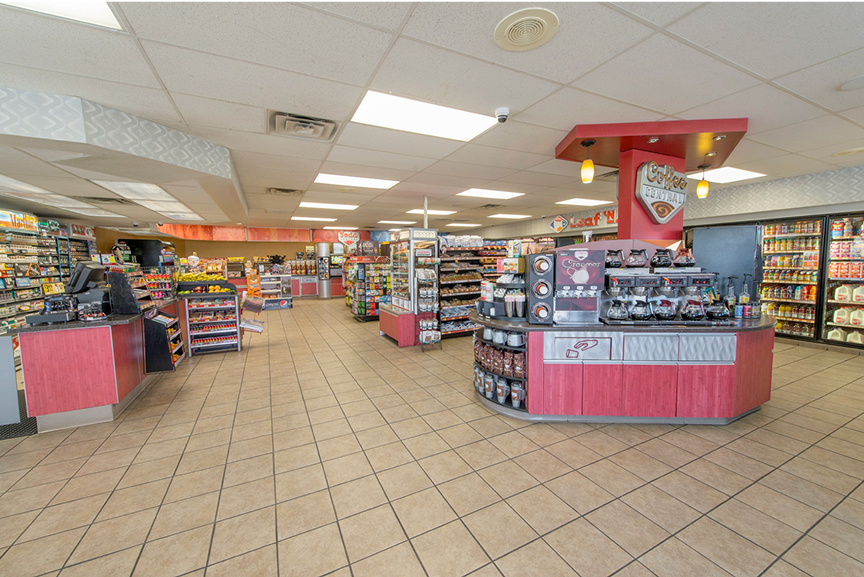
To make female-preferred products quicker and easier to find
POS offers were changed to products more commonly purchased by females.
Fruit was moved from the deli to a display by the sales counter.
Healthy bars were positioned on the counter racks that previously held energy shots and candy.
The deli case was re-merchandised to move yogurt, sandwiches and healthier options front and center.
Water, naked juice and other healthier options were added to the deli case.
Encouraging results
Loaf ‘N Jug’s pilot results highlight the fact that it’s clearly possible to make changes that attract more business from female shoppers and to grow overall sales at the same time.
Test stores
- Outperformed control stores in all major categories except beer.
- Outperformed control stores in food service and overall sales trends.
- Test stores produced the strongest growth rates (compared to controls) in healthier, low-calorie categories like yogurt, fruits, packaged sandwiches, nuts/seeds, health/energy bars, and bottled water.
- The only beverage category whose sales declined compared to control stores was carbonated soft drinks; sales in all others grew faster than in control stores.
Female shoppers definitely noticed the changes. Almost 60% noticed the flowers at the door, and about a quarter noticed the new signs, product selection and reduced clutter. Asked which changes would influence their decision to shop at Loaf ‘N Jug, product selection was the top vote getter, followed by fewer displays — and then the flowers by the door!
Control stores
- Exceeded test stores in all programs where a rack or display was removed from the test stores.
- Outperformed test stores in some key subcategories where displays were relocated/removed at test stores to decrease clutter and improve visibility.
Overall
The changes resulted in a small improvement in overall sales growth. Key reasons may be related to new signage and the improved visibility of female friendly products.
Next steps
The test was encouraging, but the time-frame was short and the results highlighted an interesting challenge:
To be successful, you need to balance the needs of traditional convenience store shoppers and female shoppers.
Take Your Mark
Each of these growth stories is different, yet they all start the same way: The convenience retailer asked (or observed) their customers to identify where there were opportunities to encourage more frequent visits and increased spending during those visits. They started with shopper research.
If you’re ready to learn from your shoppers in order to grow your convenience retail business, the Playbook toolkit is reproduced on the following pages and the resources listed below will help you get started.
Call the Playbook help desk at 847-756-3711, or email bill.bishop@brickmeetsclick.com
Sponsored by NACS/CCRRC, the help line can answer your questions about Playbook strategies and how to get started with your shopper research.
There’s no cost or obligation for this service, and it can be a great way to help you get started on this important journey.
View these earlier NACS CCRRC reports:
The Playbook for Success outlines a three-step plan for growing c-store business based on shopper research, and introduces four new business platforms.
C-growth: Using shopper research to grow c-store sales explains what shopper research is and how convenience retailers can use it to identify solid growth opportunities.
Playbook Toolkit
Shopper satisfaction survey
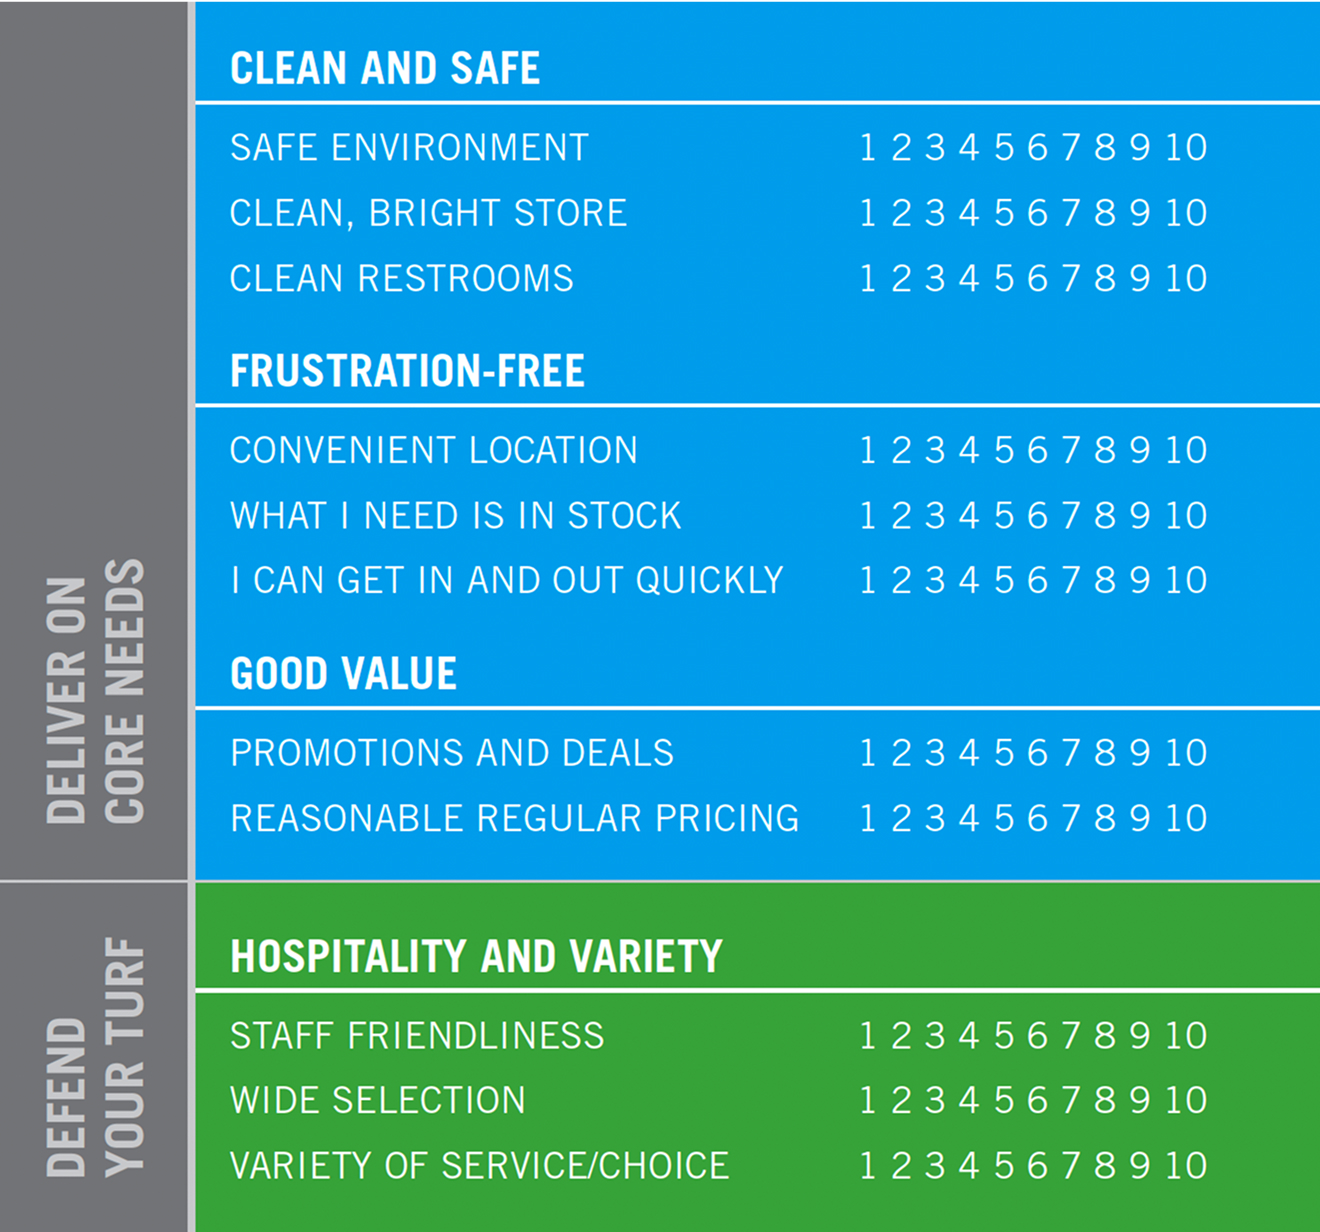
NACS/CCRRC devised this tool to help convenience retailers measure shopper satisfaction. It’s a brief customer survey you can use to determine your “Shopper Satisfaction Score” on a range of dimensions.
First, use it to identify which growth step you’re ready to tackle. Then, use it to measure the effectiveness of the changes you put into play. The shopper needs addressed relate to Steps 1 and 2 in the Playbook.
Methodology
A
Ask a sample of 100 to 200 shoppers: Based on your experience this visit, rate our performance on each attribute on the right, using a 1–10 scale (10 is high).
Based on 30,000 transactions per store per month, you would want to survey 200-350 randomly selected individuals to adequately represent your customers.
B
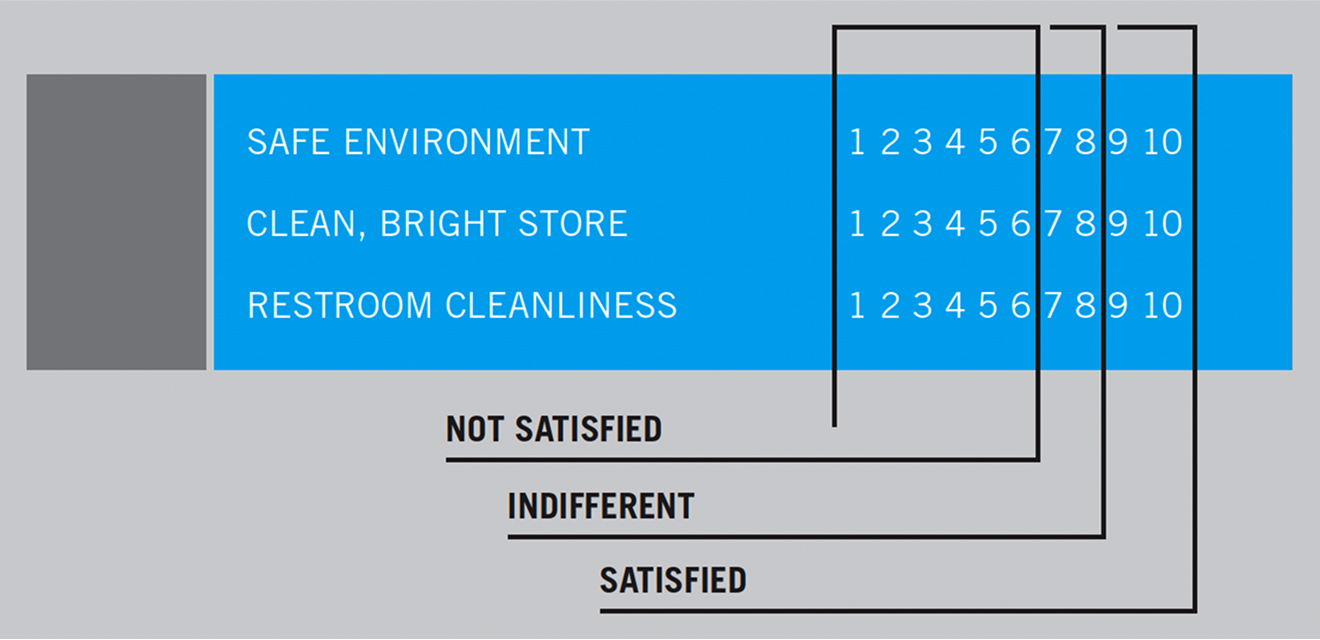
Cluster responses into three groups:
- NOT SATISFIED (all ratings of 1–6)
- INDIFFERENT (all ratings of 7 or 8)
- SATISFIED (all ratings of 9 or 10)
C
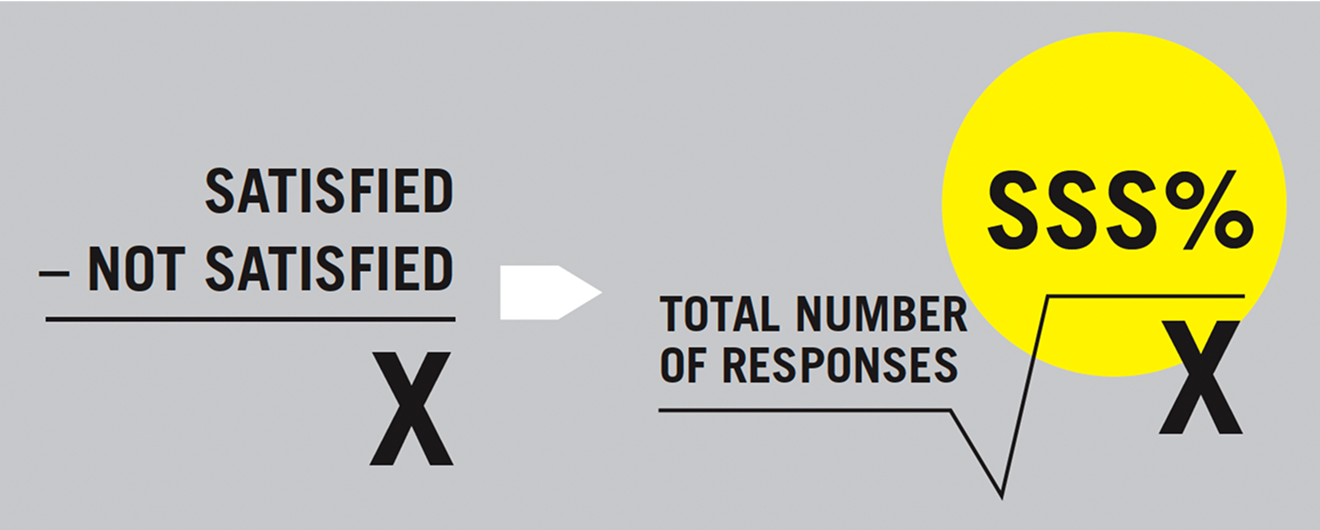
Determine your Shopper Satisfaction Score:
Subtract the number of “Not Satisfied” responses from the number of “Satisfied” responses. Then divide by the total number of responses. The resulting score is your SSS%.
D
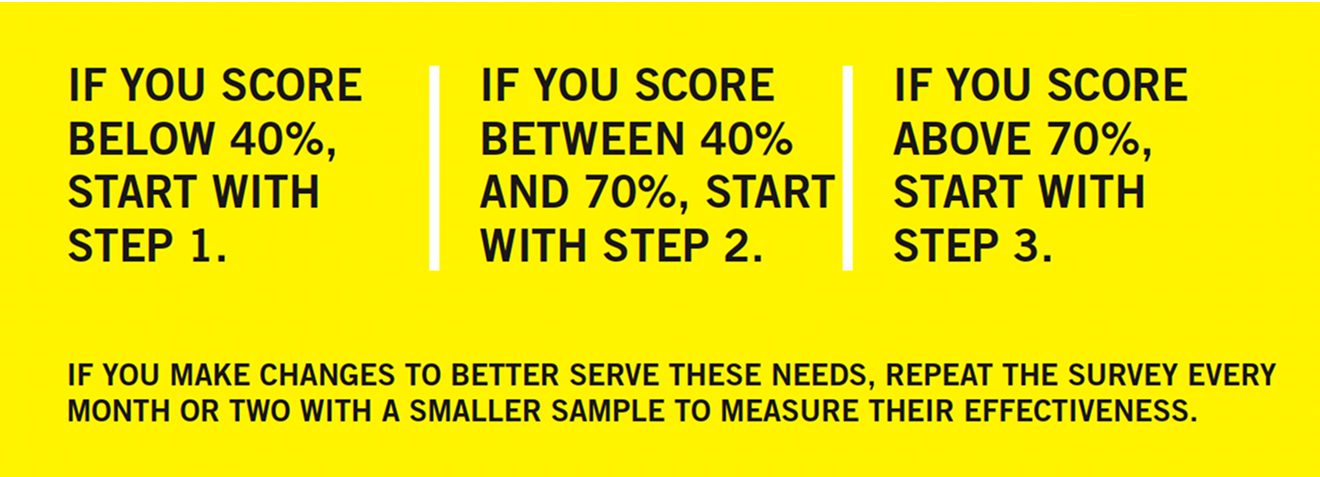
Interpret the results:
To set expectations: Results can be low. Median first-time scores are 16% — and yes, it’s possible to generate a negative score!
Step 1: Self-evaluation
Can you improve your delivery on core needs?
1: Clean and safe surroundings
Are your restrooms clean and well-maintained?
Are the interior and exterior well-lit?
Are employee uniforms and grooming neat and tidy?
Is safety training and performance part of your program?
2: Frustration-free shopping
Do you offer a good selection of products?
Do you have a replenishment program that ensure items are consistently in stock?
Do you provide clear visual cues that help the shopper?
Is all the equipment used by customers in good working order -- fuel dispenser, credit card machines, etc.?
Is it easy to get in and out of your parking lot?
Are transactions designed to be simple and quick?
Are your employees trained to know how to do their jobs?
3: Good value for your money
Are your prices in line with the competition?
Do you have special pricing or offers that encourage your customers to buy more?
Are your price labels easy to read and accurate?
Step 2: Self-evaluation
Don’t let competitors eat your lunch
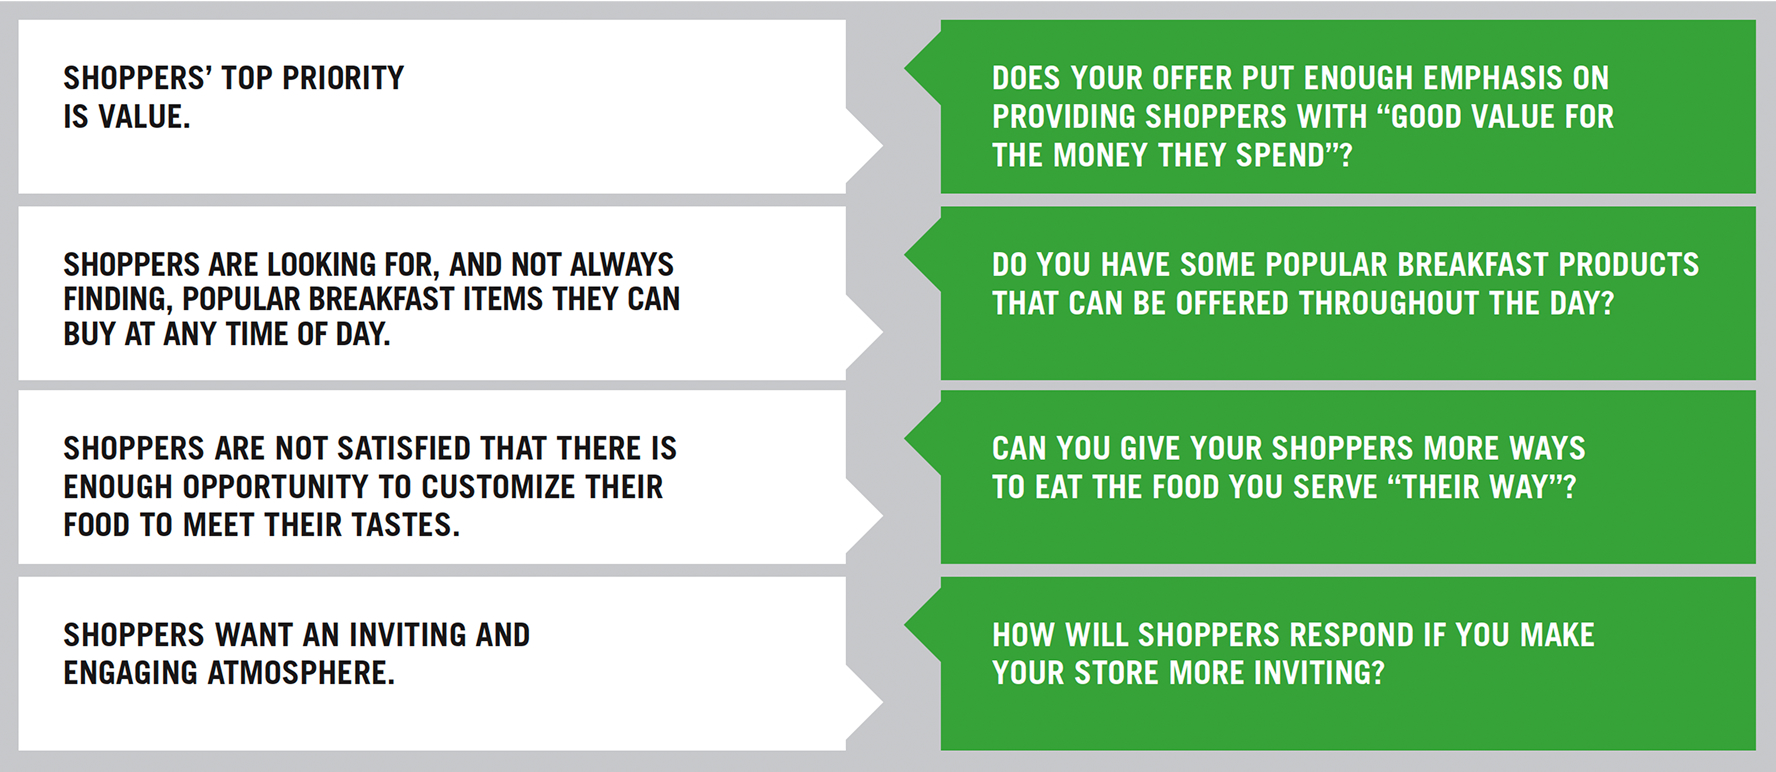
Are you offering hospitality and variety?

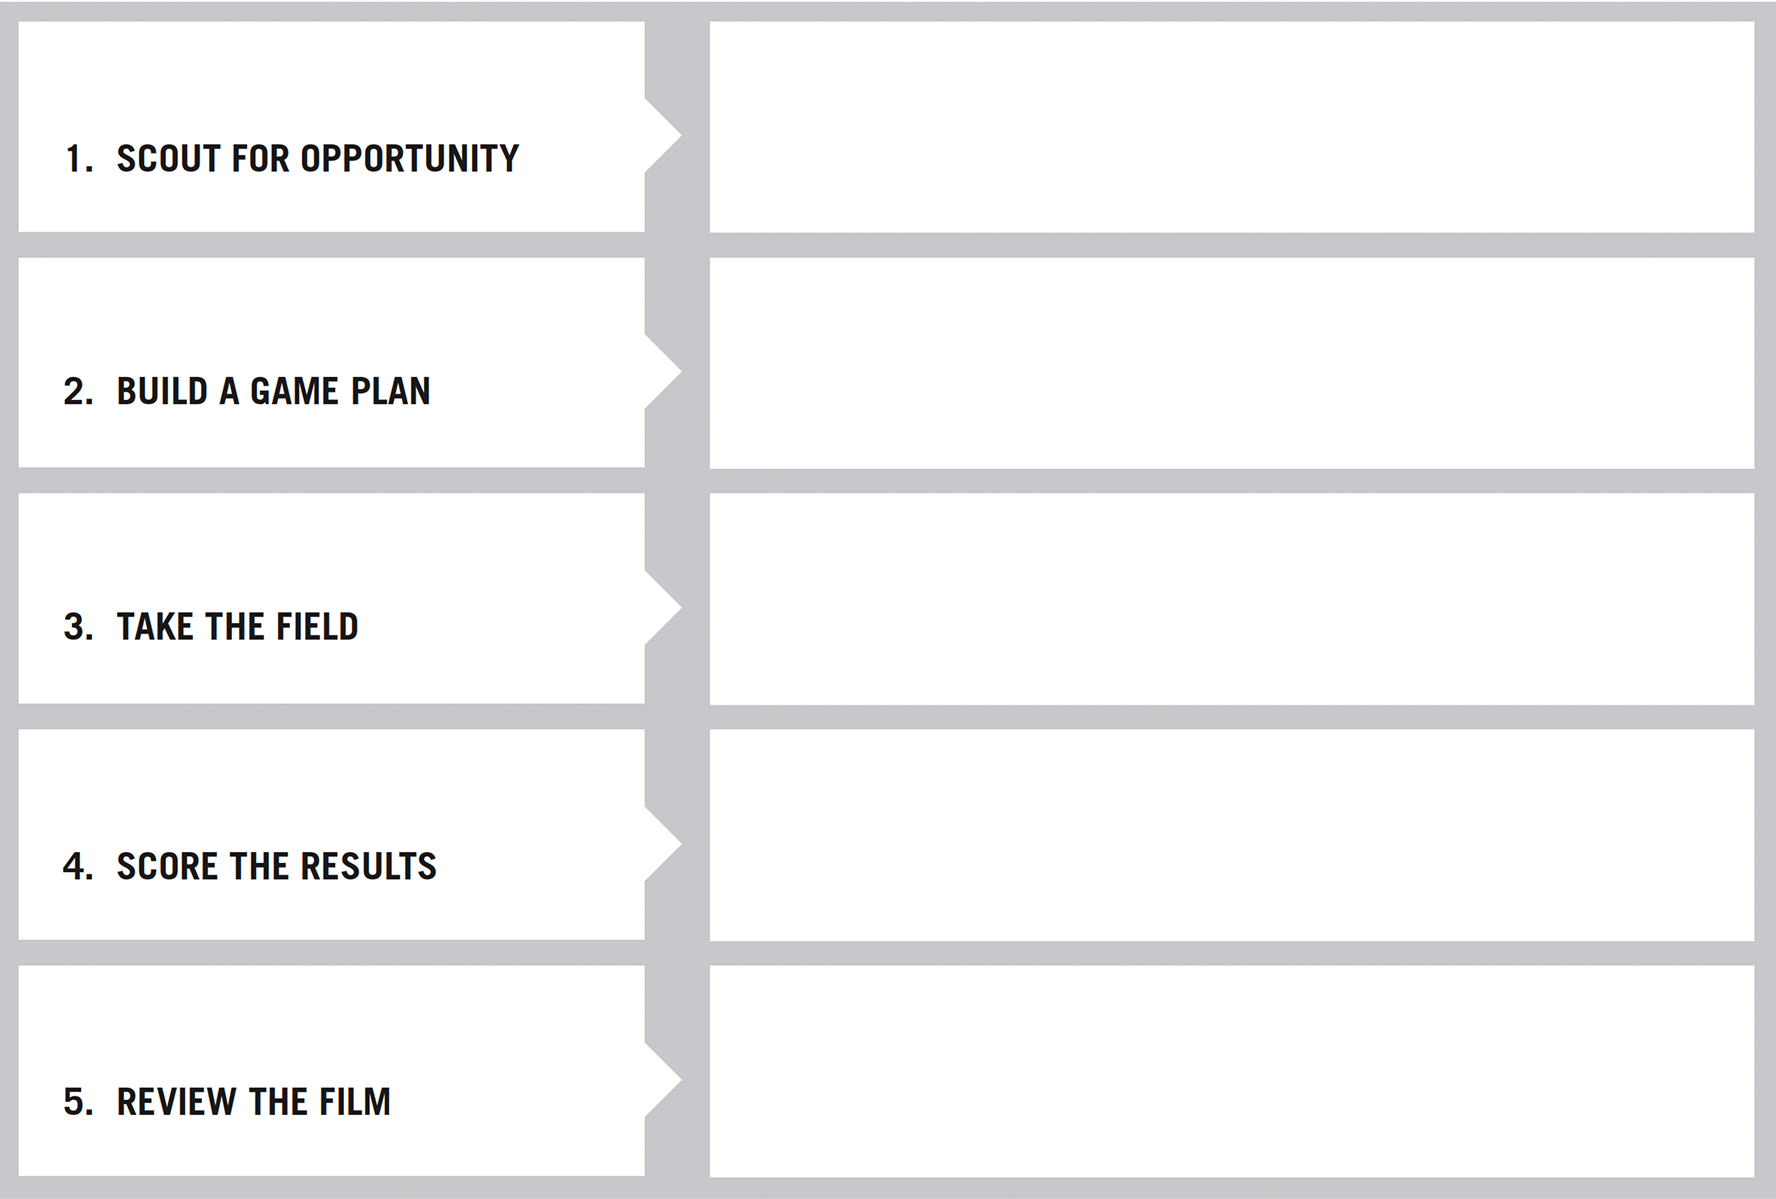
Scorecard worksheet
Use the scorecard to outline your game plan for executing against a growth platform.
The NACS Coca‑Cola Retailing Research Council
Hank Armour
NACS
Brent Blackey
Holiday Companies
Dave Carpenter
J.D. Carpenter Cos.
Carol Jensen
Wawa, Inc.
Allison Moran
RaceTrac
Art Stawski
Loaf ‘N Jug
Alan Beach
7-Eleven
Rahim Budwani
6040 LLC
Fran Duskiewicz
Nice ‘N Easy Grocery Shoppes
Dae Kim
NACS
Eduardo Padilla
OXXO
Brad Williams
Mid-Atlantic Convenience Stores (MACS)
Alain Brisebois
Alimentation Couche-Tard Inc.
Brad Call
Maverik
Dough Fritsch
IGA
Karl Kruse
Hy-Vee
Glenn Plumby
Speedway
Who We Are
The NACS Coca‑Cola Retailing Research Council is composed of convenience industry leaders from around the world. It conducts studies on issues that help retailers respond to the changing marketplace. The unique value of these studies rests with the fact that retailers define the objective and scope of each project and “own” the process through the release of the study and its dissemination to the broader retail community.
Our Mission
To identify big issues facing convenience retailers, do research that uncovers ways to deal with them, and then encourage retailers to use these new ideas to improve their business.
Acknowledgements
Many thanks to the retailers listed below. Their willingness to share their experiences using the Playbook’s research methods, principles, tools and growth platforms made this report possible.
- Handy Mart
- Meiners Companies
- Mid-Atlantic Convenience Stores (MACS)
- Holiday Station stores
- Loaf ‘N Jug
Special appreciation is extended to 5one for the significant contribution they made by introducing us to and demonstrating the value of basket missions.
We also want to acknowledge NACS Magazine and Convenience Store News, where some of this material was first published.
Finally, thank you to Bill Bishop of Willard Bishop and Brick Meets Click for his guidance and counsel as the facilitator and coordinator of this project for the Council, and to Susan Lindsay and Randy Allison for translating this work in to a clear and accessible report.
